(NOTE: this first appeared on Substack here)
In this lesson we trained a prediction model from scratch. It was pretty interesting to see the inner-workings here. The notebook Jeremy works with mostly is one about training a linear regression model to predict who survived or died aboard the titanic.
The most useful stuff of this chapter was some of the clever stuff of how to use Pandas: working with DataFrames (checking the head, histogram, etc), when to use the log of a column, normalization, creating dummies for non-numerical variables, catching unfilled elements, etc.
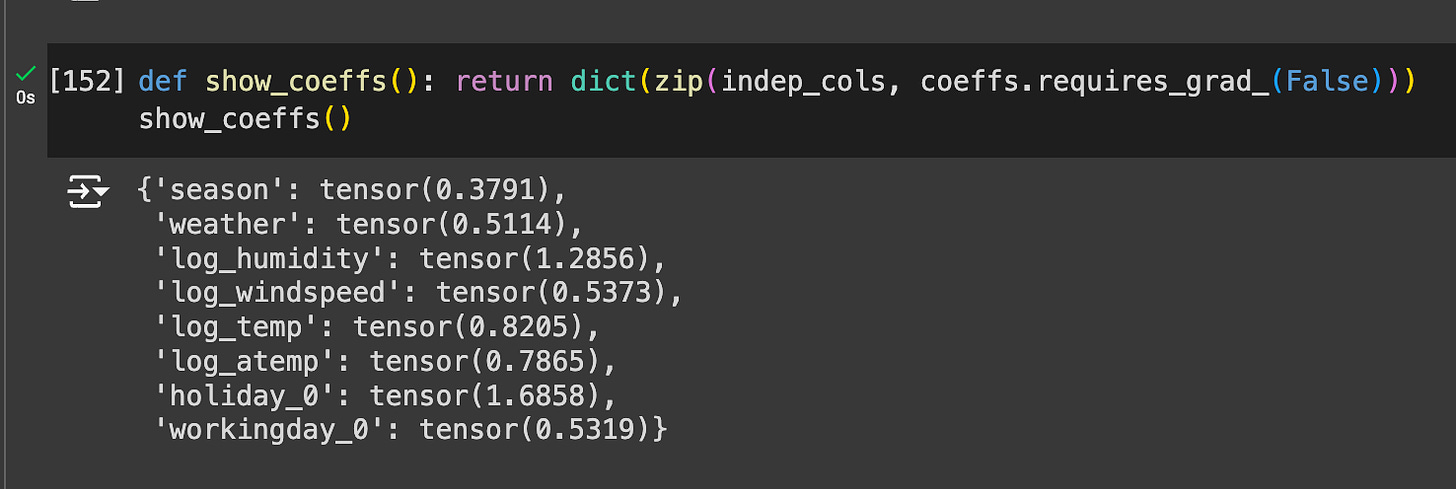
First, we train a linear model, which simply gets coefficients for multiplying each independent variable. Then we add a neural net, and later, a second layer, making for deep learning. It was neat to be able to follow the math her so closely; particularly, being able to actually inspect the coefficients in a layer and see what was going on:
As you can see above, I used a different dataset to test my understanding here, one from Kaggle that deals with bike rentals.
Most of my tweaks, versus the titanic dataset, were:
-
taking the log of tons of variables (humidity, windspeed, temp, airtemp)
-
converting whether things were a holiday or working day into ints
-
predicting to a number versus a binary result (including changing some internal functions)
I think my results are pretty good, only off by about 0.3 on average from the actual number of rented bikes.
There’s then a rehash of this in a separate notebook called “Why you should use a framework” that does the same using TabularPandas.
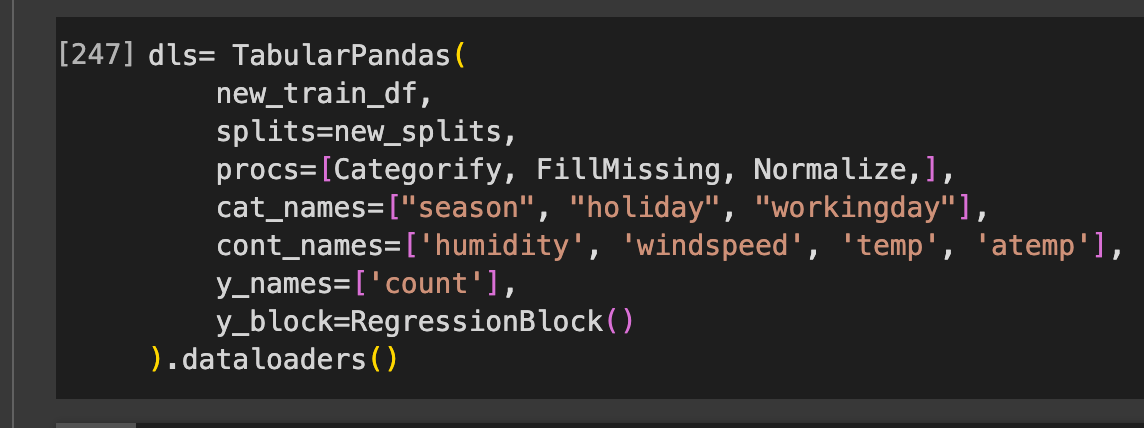
I did this all in the same notebook as above:
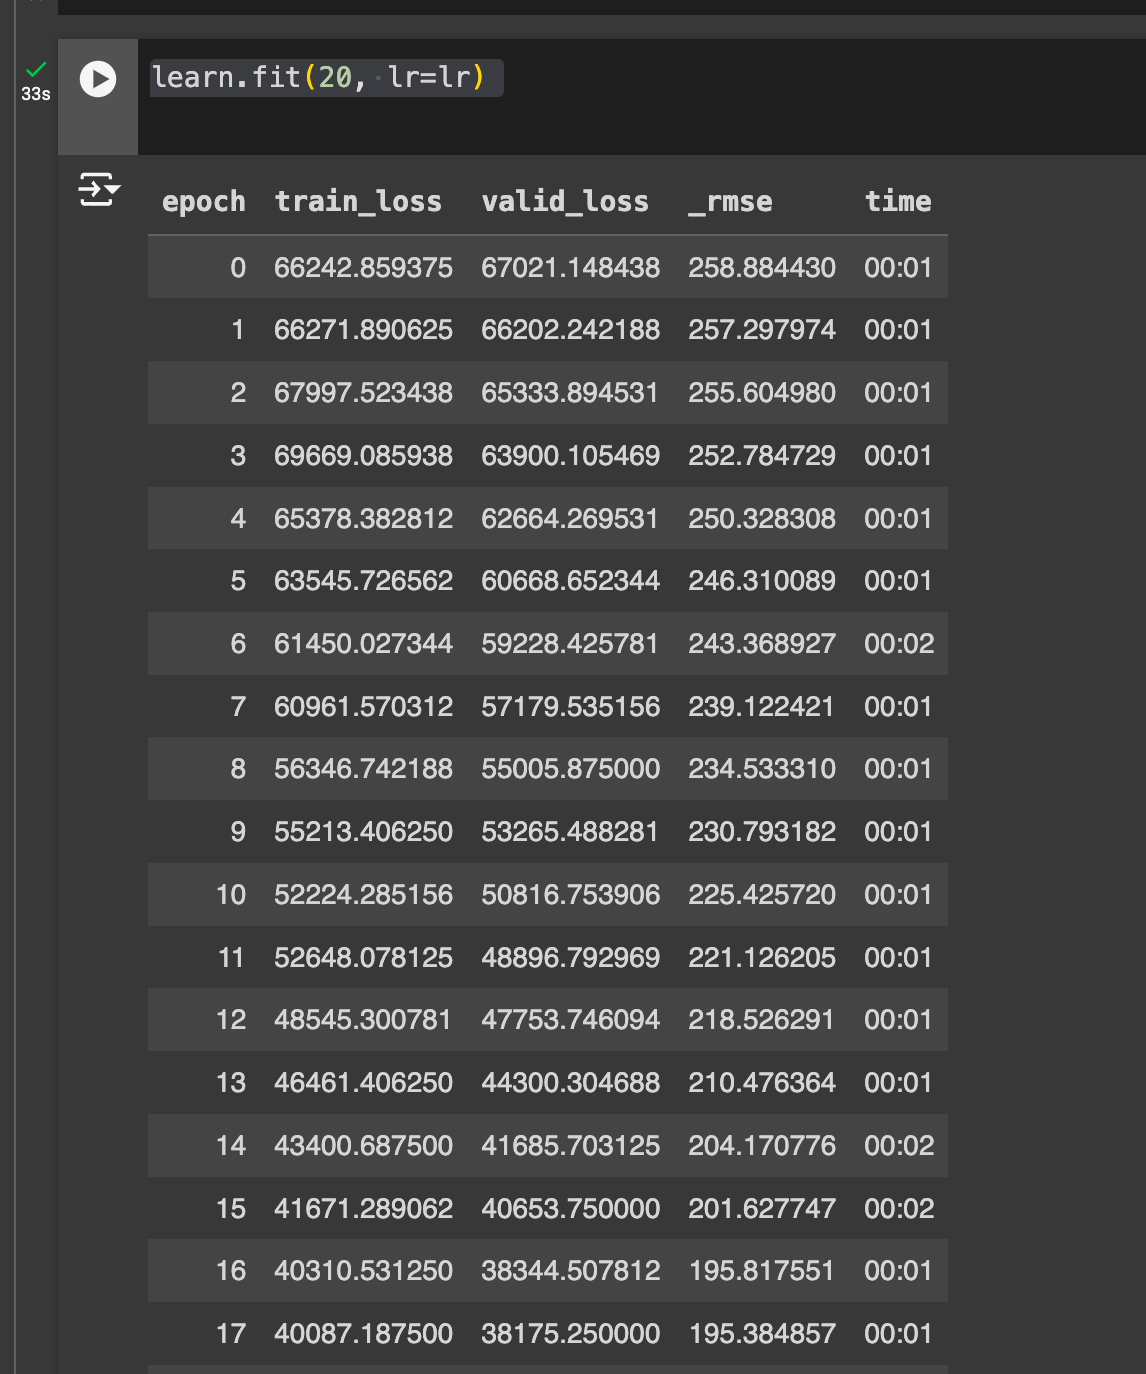
Setup was certainly easier. Not too much was tricky here, just swapping out the categorical vs. continuous names, and swapping from a CategoryBlock() to RegressionBlock(), plus changing from accuracy to rmse as a metric.
It’s certainly learning!
Chapter 9 of the book, which I read for this, was pretty standard. The biggest takeways were:
-
embeddings are super useful, typically better than “dummy” variables and have great improvements even for non-neural net approaches
-
decision-trees are much more explainable than ML methods and often make more sense
-
there’s lots of interesting metadata for certain columns that is useful to provide to a model (for example: for dates, whether it was a holiday, what season it was, etc)
-
ways to make simpler models by removing certain redundant features (not a ton of discussion of feature engineering - seems like this is picked up or covered later)
-
ensemble methods and boosting with multiple trees
We didn’t get to any of the random forest stuff in this lesson, but I can see from the site that it’s next.
I filled these questions out a day after reading the chapter, so remember fewer of the things than I would’ve previously: hence, correcting this was particularly useful! (And there’s some learning science, I believe, about remembering things better once you’ve failed to figure them out the first time). Anyways, here’s my answers to the Chapter 9 questions:
- ✅ What is a continuous variable?
Essentially, numerical variables (some stuff missing here, see def for categorical variable)
- ✅ What is a categorical variable?
Essentially a discrete variable, with a finite set of options. This can be a string (i.e. “Season”: “Fall”, “Winter”, “Spring”, “Summer”), or a number that also represents a category.
- ✅ Provide two of the words that are used for the possible values of a categorical variable.
Fall, Winter (NIT: weird question, they are looking for layers or categories)
- ✅ What is a "dense layer"?
A linear layer of a neural net
- ❌ How do entity embeddings reduce memory usage and speed up neural networks?
They get categorical variables into continuous variables and allow for easier manipulation? I’m sure there more here. (Sorta: more correctly, it’s very inefficient and sparse to use one-hot vectors, i.e. “isThiSClas” for 500 classes. more memory-efficient/dense representations that provid e speedups)
- ✅ What kinds of datasets are entity embeddings especially useful for?
Those that have lots of high cardinality (i.e. - many possible options) columns
- ✅ What are the two main families of machine learning algorithms?
Decision trees and deep learning (note: random forests? decision trees) (NIT: yes, “ensembles of decision trees” and “multilayered neural nemts”
- ✅ Why do some categorical columns need a special ordering in their classes? How do you do this in Pandas?
Some have sequential orderings, i.e. fall comes after summer. I don’t remember how this is done in pandas! (Note: re Pandas: ordered=True) in the col!)
- ✅ Summarize what a decision tree algorithm does.
At each point, based on some pivot in some variable, splits the data into two separate paths. Eventuually it makes a decision (or splits the data again)
- ✅ Why is a date different from a regular categorical or continuous variable, and how can you preprocess it to allow it to be used in a model?
It contains lots of date metadata, i.e. whether or not it was a holiday, day of the week, etc
- ✅ Should you pick a random validation set in the bulldozer competition? If no, what kind of validation set should you pick?
You should pick data from later as validation, because the test data comes from even later!
- ✅ What is pickle and what is it useful for?
Pickle allows for saving of models and model checkpoints in python.
- ❌ How are
mse,samples, andvaluescalculated in the decision tree drawn in this chapter?Read this a few days ago, don’t remember. (Note: Nodes in the decision tree have this answer)
- ❌ How do we deal with outliers, before building a decision tree?
Sometimes we exclude or minimize them from the model, or recognize that they represent a different istuation and build a second model for them (Predict whether a row is in the validation set or the training set, LOL, oor use a random forest )
- ✅ How do we handle categorical variables in a decision tree?
Convert them to dummy variables or to embeddings.
- ❌ What is bagging?
I believe: we use one decision tree, and then take the results of that (one “bag”) as input into another (NOPE: this refers to ensembles!)
- ✅ What is the difference between
max_samplesandmax_featureswhen creating a random forest?Max features is number of thigns we can pivot on, where max_samples is max number of things that fall into that classification (yep - how many samples, vs. how many coumns of the dataset we use)
- ❌ If you increase
n_estimatorsto a very high value, can that lead to overfitting? Why or why not?Yes, there could be more categories than samples (I misunderstood here: n_estimators is the number of trees you are using, just more in the ensemble!)
- ❌ In the section "Creating a Random Forest", just after <<max_features>>, why did
preds.mean(0)give the same result as our random forest?Because we are splitting directly in the middle? don’t remember
- ❌ What is "out-of-bag-error"?
Don’t remember (oh yeah! we don’t need to split into a train vs. validation set, we can evaluate based on everything not in this bag, i.e stuff not in the training set)
- ❌ Make a list of reasons why a model's validation set error might be worse than the OOB error. How could you test your hypotheses?
Don’t remember (NOTE: if the model doesn’t generalize well, or if the validation set is distributed differently than the training set)
❌ Explain why random forests are well suited to answering each of the following question:
- How confident are we in our predictions using a particular row of data?
Standard deviation between estimators
* For predicting with a particular row of data, what were the most important factors, and how did they influence that prediction?
treeinterpreter package see prediction changes going thru tree
* Which columns are the strongest predictors?
feature importance
* How do predictions vary as we vary these columns?
partial dependence plots
Need help here.
- ✅ What's the purpose of removing unimportant variables?
Simpler model (NIT: also more interpretable!)
- ❌ What's a good type of plot for showing tree interpreter results?
Decision tree? NOTE: waterfall plot!
- ✅ What is the "extrapolation problem"?
Hard to apply models to out of domain data and we don’t always get it right. (NIT: worse than neural nets)
- ❌ How can you tell if your test or validation set is distributed in a different way than your training set?
Not sure, would probably histogram it. (NO: use model to classify if data is training or validation data)
- ❌ Why do we ensure
saleElapsedis a continuous variable, even although it has less than 9,000 distinct values?For easier fitting? (variable changes over time)
- ✅ What is "boosting"?
This might’ve been what I referred to as bagging above, essentially chaining a bunch of decision-trees together. (NIT: one model that underfits data, train subsequent models to predict error and combine predictions)
- ❌ How could we use embeddings with a random forest? Would we expect this to help?
Not sure. (NOTE: this one was pretty easy,
- ✅ Why might we not always use a neural net for tabular modeling?
Very computationally intensive and easy to screw up! Often overkill! (Also - less interpretable!)


